Main Text
1 Introduction
Lung cancer is one of the malignant tumors with the highest morbidity and mortality in China, and the number of new cases is on the rise in recent years [1]. In accordance with the latest cancer statistics reports, there are a total of 4,064,000 new cancer cases in 2016 in China, where lung cancer cases account for 20% [1]. Notably, non-small cell lung carcinoma (NSCLC) is the most common histological type in lung cancer, making up from 80% to 85% [1]. Sixty to seventy percent of NSCLC patients are already at the advanced stage when diagnosed, thus missing the optimal opportunity for treatment and having poor prognosis [2]. In recent years, on the basis of traditional chemotherapy and radiotherapy, epidermal growth factor receptor tyrosine kinase inhibitors (EGFR-TKIs) have been included in the first-line therapy for NSCLC in Western medicine [3]. Although EGFR-TKIs have improved the overall survival of NSCLC patients to some extent, most patients cannot benefit from the existing Western treatment pattern due to the subsequent problem of drug resistance [3,4]. Therefore, it is urgent to find a novel therapy for the resistance to EGFR-TKIs, so as to improve the overall survival and prognosis of NSCLC patients.
Traditional Chinese Medicine (TCM) is a critical component of conventional medicine in China, with thousands of years of practice and experience in the treatment of malignant tumor and its comorbidities. Ramulus Cinnamomi (RC) is a traditional herbal medicine with acrid-sweet flavor, warm nature and no apparent toxicity, which possesses the efficacies such as relieving exterior syndrome by diaphoresis, eliminating wind to dispersing cold as well as reinforcing yang to promote qi transformation [5,6]. In modern pharmacological studies, over hundreds of chemical components have been identified in RC, including phenylpropanoids, terpenoids, flavonoids, organic acids, etc. [5,6]. Cinnamaldehyde, a representative phenylpropanoid, has been intentively attested to have multiple biological activities such as anti-tumor, anti-oxidation and anti-inflammation [5-7]. More importantly, Li et al. have discovered that RC can repress the proliferation and migration of human NSCLC cell line A549 in vitro [8]. Meanwhile, Pan et al. also have found that RC can inhibit the growth of rectal tumor in mice in vivo [9]. Classical TCM compound preparations with RC, such as Guizhi Fuling Pills [10,11], Chaihu Guizhi Decoction [12], and Huangqi Guizhi Wuwu Decoction [13], have been widely appied in the clinical treatment of assorted malignant tumors such as lung cancer. Furthermore, independent studies have also revealed the detailed therapeutic mechanism of RC in treating cancer, and multiple molecules and signaling pathways that regulates cell proliferation were reconginzed as important mediators, such as cyclin D1, Wnt/β-catenin signaling, PI3K/Akt/mTOR signaling and Akt/ERK signaling [9,14,15]. Nevertheless, the molecular target and relevant machnism of RC in treatment of NSCLC are dearth of full understanding, and whether RC can become the potential therapy for the resistance to EGFR-TKIs in NSCLC patients is poorly defined.
High-throughput sequencing has been employed in transcriptomics to investigate the the expression and regulatory mechanism of whole genes in cells at the RNA level, which intensively promotes the discovery of biomarkers for diseases and therapeutic targets for drugs as well as their molecular mechanisms, providing new clues for the research of TCM drugs. This study is powered to analyze and compare the effect and key molecular mechanism of RC on the function of NSCLC cell lines A549 (wild-type EGFR) and H1650 (mutant-type EGFR) through cytological experiments and transcriptomics, so as to provide a theoretical fundation for the clinical application of RC in ameliorating the resistance to EGFR-TKIs in NSCLC patients.
2 Materials and methods
2.1 Cell lines
Cell lines A549 (Cat No.: CL-0016) and H1650 (Cat No.: CL-0166) were purchased from Procell Life Science & Technology Co., Ltd. (Wuhan, China).
2.2 Main reagents
Ramulus Cinnamomi (RC) was provided by College of Medicine, Jiaxing University. Gefitinib (Cat No.: 184475-35-2) was purchased from MedChemExpress (Shanghai, China). RPMI-1640 medium (Cat No.:0491), penicillin-streptomycin, dimethyl sulfoxide (DMSO) (Cat No.: D8370), and methyl thiazolyl tetrazolium (MTT) kit (Cat No.: M1020) were bought from Solarbio Science & Technology Co., Ltd. (Beijing, China).
2.3 Cell culture
A549 and H1650 cells were placed in RPMI-1640 medium containing 10% heat-inactivated fetal bovine serum (FBS), penicillin (100 U/mL) and streptomycin (100 μg/mL), and then cultivated in a 5% CO2 incubator at 37℃. Cells that reached about 80% confluence were normally passaged, and those at the logarithmic growth phase were selected for grouping experiments. In each cell line, four groups were divided: control group that treated with phosphate buffered saline (PBS), RC group, gefitinib group, and RC & gefitinib group. Each group contains about 10,000 cells.
2.4 Preparation of RC water extract
1 g of dried RC was weighed, broken and put into a glass container. Next, distilled water was added, followed by being heated and boiled for 30 minutes (mins) of extraction to the final volume of 10 mL. Later, 5 mins of centrifugation at 3,000 rpm/min was conducted, and the supernatant was removed to obtain 0.1 g/mL of RC water extract.
2.5 MTT assay
A549 and H1650 cells were put in 96-well plates, cultured until fusion, and then treated with the RC, gefitinib or the combination of those two drugs for 24 h. For the study of time-dependent effect, RC, gefitinib or the combination of those two drugs was administered for 24 h, 48 h, and 72 h. For the study of dose-dependent effect of RC, 0.008, 0.016, 0.032, 0.064, 0.12, 0.25, 0.5, 1, 2 mg/mL of RC water extract was administered. If not specifically stated, in other experiments, the final used concentration of RC water extract was 0.5 mg/mL. Thereafter, the supernatant of the medium was removed, and cells were rinsed with PBS. Following addition of MTT reagent (0.5 mg/mL) into each well, cells were placed in an incubator for 2 h of cultivation. Afterwards, the remaining MTT reagent was sucked and 100 μL of violet crystal dissolved in DMSO was supplemented in each well. Finally, the absorbance at 570 nm was determined by a microplate reader, based on which the cell viability was calculated.
2.6 RNA extraction and detection
Total RNA was extracted utilizing Trizol-chloroform method. The purification of RNA was realized by Purification Kit (Cat No.: 15596026, Invitrogen, USA). Agilent 2100 bioanalyzer (Agilent Technologies, CA, USA) was employed for the accurate determination of RNA integrity and quantitation.
2.7 Library construction
Herein, the total RNA was used as the initial RNA. Then, the mRNA with poly (A) tails was enriched by Oligo (dT) beads, and randomly fragmented by divalent cation in fragmentation buffer. With random oligonucleotide as the primer, the first strand complementary DNA (cDNA) was synthesized in M-MuLV reverse transcriptase system, and the RNA strand was degraded by RNaseH. Under the help of DNA polymerase I system, the second strand cDNA was synthesized, with dNTPs as the raw material. Next, the purified double-strand cDNA was subjected to end repair, addition of A tail and connection of sequencing connector. Subsequently, AMPure XP beads were employed to screen the cDNA with 370~420 base pairs (bp), followed by PCR amplification. Thereafter, PCR products were further purified by AMPureXP beads to acquire the library. Following that, Qubit2.0 Fluorometer (Thermo Fisher Scientific Inc., Waltham, USA) was adopted for preliminary quantification. After the library was diluted to 1.5 ng/μL, Agilent 2100 bioanalyzer (Agilent Technologies, Inc., Santa Clara, USA) was utilized to determine insert size of the library. When the insert size was in line with expectations, qRT-PCR was implemented for the accurate quantitation of the effective concentration of library (> 2 nM), in order to guarantee the quality of library.
2.8 Transcriptome sequencing
After the library was qualified after detection, different libraries were pooled based on the requirements of effective concentration and target off-machine data volume. Illumina NovaSeq platform (Illumina, Inc., San Diego, USA) was used for sequencing.
2.9 Data analysis
2.9.1 The screening of differentially expressed genes (DEGs)
R pakage DESeq2 software (version 1.20.0) [16] was harnessed for the comparison and analysis of DEGs between groups. The method of Benjamini & Hochberg was applied for obtaining the adjusted p value (padj). Then, the logarithm of expression difference was taken, where genes with |logFC| > 1 and padj < 0.05 are identified as DEGs. R pakage Venn (https://github.com/dusadrian/venn) was used to draw a Venn diagram to analyze the intersecting DEGs in two types of cells.
2.9.2 Enrichment analysis of DEGs
R pakage clusterProfiler (version 3.8.1) [17] was utilized, with the filter criteria of padj < 0.05 and FDR < 0.05. Then, the filtered DEGs were subjected to Gene Ontology (GO) annotation analysis and Kyoto Encyclopedia of Genes and Genomes (KEGG) pathway enrichment analysis.
2.9.3 Gene set enrichment analysis (GSEA)
R pakage clusterProfiler (version 3.8.1) [17] was adopted to obtain the gene set of c2.cp.v7.2.symbols from Molecular Signatures Database (MSigDB) [18], with the filter criteria of padj < 0.05 and FDR < 0.05. Then, enrichment analysis of filtered DEGs was carried out. Subsequently, the parameters were analyzed, where the seed value was set as 2021, and the calculation frequency was 1,000. Each gene set contained a minimum of 10 genes and a maximum of 500 genes.
2.9.4 Analysis on protein-protein interaction (PPI) network of DEGs
The enriched cell cycle and DNA replication-related DEGs were entered in String database (http://string-db.org) [19], with the species of Homo sapiens and the minimum interaction threshold of 0.9 (high confidence). Next, the obtained data were imported into Cytoscape software (version 3.9.1) to construct a PPT network for key molecles. Thereafter, key hub genes in the PPI network were searched by the Degree Algorithms in Cytoscape software (version 3.9.1), and the top 20 genes were selected for visualization.
2.10 Real-time quantitative polymerase chain reaction (q-PCR)
Initially, 500 ng of RNA was inversely transcribed into cDNA under the help of reverse transcriptase (Cat No.: RR036, Takara, Japan). The reaction conditions were set as follows: 37℃ for 15 min and 85℃ for 5 seconds (s). Next, cDNA was added with fluorochrome (Cat No.: RR820, Takara, Japan), synthesized with primers to be 20 μL of amplification templates and amplified in Roche 480 fluorescence q-PCR instrument. The reaction procedures were performed as follows: 95℃ for 30 s, and 40 cycles of 95℃ for 5 s and 60℃ for 20 s. ACTB (β-actin) was exploited as the housekeeping gene, and the relative expression level was calculated based on 2−ΔΔCT method [20]. The primer sequences are detailed in Table 1.
Table 1 qPCR primer sequences.
| Genes | Extension direction | Nucleotide sequence |
|---|---|---|
| CDK1 | Forward | AAACTACAGGTCAAGTGGTAGCC |
| Reverse | TCCTGCATAAGCACATCCTGA | |
| CDK2 | Forward | AGGCATGAGGAATCTGGGAG |
| Reverse | GAGGTGGACGTCAGAGGAAA | |
| CCNA2 | Forward | CAGAAAACCATTGGTCCCTC |
| Reverse | CACTCACTGGCTTTTCATCTTC | |
| CCNB1 | Forward | TGGGTCGGCCTCTACCTTTGCACTTC |
| Reverse | CGATGTGGCATACTTGTTCTTGACAGTCA | |
| CDC6 | Forward | GGGTGAAGGCTGCGGGTTCC |
| Reverse | GCCCAGACGTTTCCTGGGGC | |
| ACTB | Forward | GGATGCAGAAGGAGATCACTG |
| Reverse | CGATCCACACGGAGTACTTG |
2.11 Statistical analysis
All measurement data were expressed as mean ± standard deviation (SD). The comparison between two groups was made by t test, and the comparison among multiple groups was implemented by one-way analysis of variance. GraphPad Prism 6 (GraphPad, Inc., La Jolla, CA, USA) was harnessed for statistical analysis. The statistical significance was defined when the p-value was below the threshold of 0.05.
3 Results
3.1 RC repressed the proliferation of A549 and H1650 cells
RC water extract suppressed the proliferation of NSCLC cell lines A549 and H1650 in a dose-dependent (Figure 1A) and time-dependent (Figure 1B) manner. The half-maximal inhibitory concentration (IC50) of RC in repressing the proliferation of A549 and H1650 cells was 0.59 ± 0.03 mg/mL and 0.44 ± 0.04 mg/mL (Figure 1A), suggesting that A549 and H1650 cells had the same sensitivity to RC. Besides, RC and gefitinib exerted positive synergistic effects on repressing the proliferation of A549 and H1650 cells (Figure 1B,1C). Moreover, IC50 of RC and gefitinib alone or together in repressing the proliferation of A549 cells was 19.72 ± 0.08 μM and 9.92 ± 0.06 μM (Figure 1C), and IC50 of RC and gefitinib alone or together in repressing the proliferation of H1650 cells was 16.80 ± 0.07 μM and 7.64 ± 0.04 μM (Figure 1C).
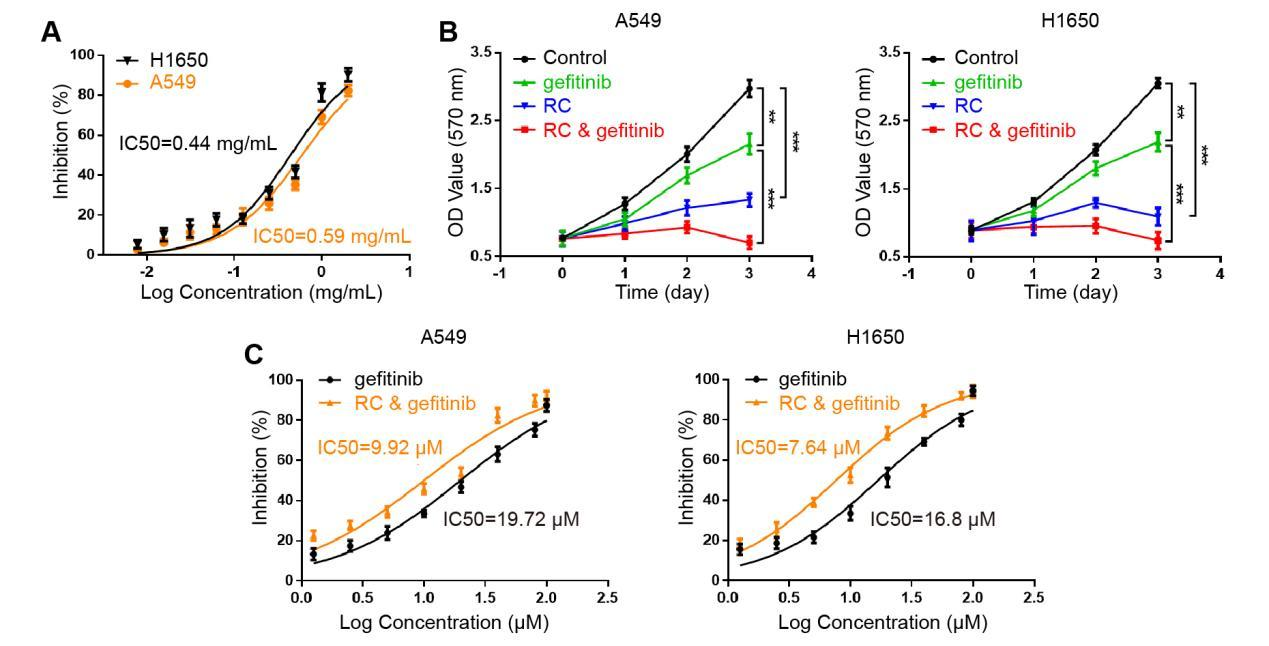
Figure 1 Effects of RC on the proliferation of A549 and H1650 cells. A. Concentration-effect curve of RC in suppressing the proliferation of A549 and H1650 cells (n = 3). B. The effects of RC (0.5 mg/mL) and gefitinib (10 μM) alone or together on the proliferation of A549 and H1650 cells at different time (n = 3). Gefitinib group vs. control group, **p < 0.01; RC group vs. control group, ***p < 0.001; RC & gefitinib group vs. gefitinib group, ***p < 0.001. C. Concentration-effect curve of RC (0.5 mg/mL) and gefitinib at 1.25, 2.5, 5, 10, 20, 40, 80, 100 μM in repressing the proliferation of A549 and H1650 cells (n = 3).
3.2 Transcriptomics analysis on the mechanism of RC in repressing the proliferation of A549 and H1650 cells
Following the treatment of A549 cell line with RC (0.5 mg/mL), there were 5,316 differentially expressed genes (DEGs) (Figure 2A; padj < 0.05, |logFC| > 1), with 2,444 up-regulated genes and 2,872 down-regulated genes (Figure 2B). The top ten DEGs with significant changes in expression included up-regulated genes such as C11orf96, PRSS22 and RMRP, as well as down-regulated genes such as FANCB, ZNF714 and SERPINI1 (Table 2). Through gene set enrichment analysis (GSEA), it was discovered that the up-regulated genes were enriched in cell adhesion molecules, lysosomes and neuroactive ligand-receptor interaction pathways, while the down-regulated genes were enriched in cell cycle, DNA replication, RNA degradation and splicing pathways (Figure 2C). As Kyoto Encyclopedia of Genes and Genomes (KEGG) pathway enrichment analysis shown, the up-regulated genes were coupled with multiple pathways of neurodegenerative disease (eg. Alzheimer's disease) and human papillomavirus infection, while the down-regulated genes were mainly associated with pathways of cell cycle, spliceosome and nucleocytoplasmic transport (Figure 2C). Under the help of Gene Ontology (GO) function enrichment analysis, it was found that up-regulated genes were significantly enriched in biological processes (BP) including autophagy regulation and macroautophagy, where cellular components (CC) were involved in vacuole membrane, lysosomal membrane as well as dissolved vacuole membrane, and molecular function (MF) was implicated with cadherin binding, GTPase binding as well as ribosome components. For the down-regulated genes, they were enriched in BP such as biosynthesis of ribonucleoprotein complex, RNA splicing, and non-coding RNA processing, etc. CC mainly included chromosome regions, spindle, and chromosome-densifying regions, whereas the major MFs were ATP-hydrolyzing activities as well as enzyme-catalyzed activities acting on both RNA and DNA (Figure 2E).
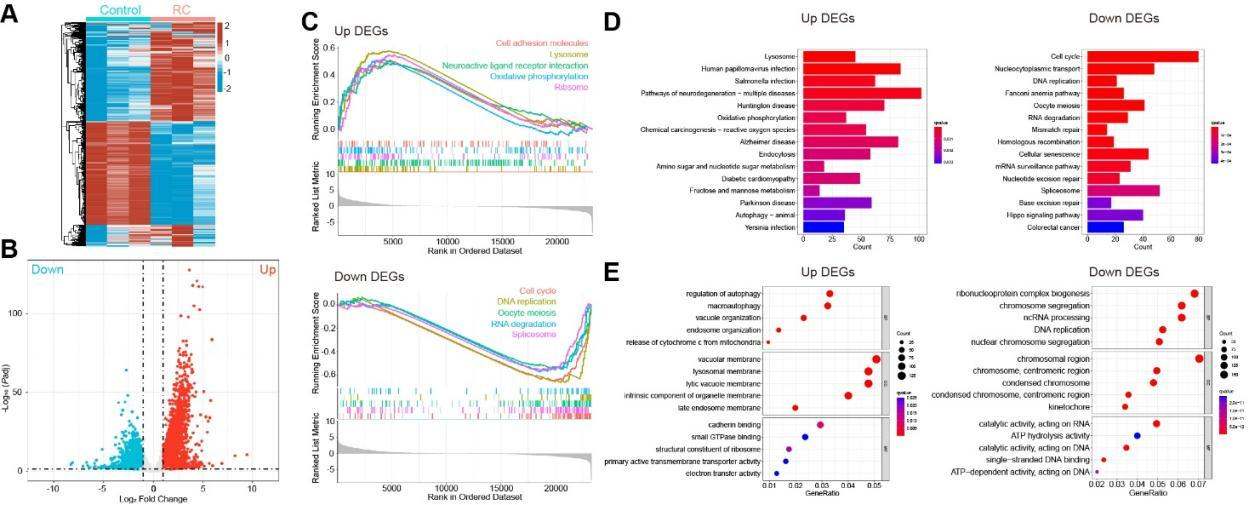
Figure 2 Transcriptomics analysis of gene changes in A549 cell line treated with RC. A549 cell line was treated with RC water extract (0.5 mg/mL). A. The heat map of DEGs (padj < 0.05, |logFC| > 1; red: up-regulated genes; blue: down-regulated genes). B. Volcano map of DEGs (red: up-regulated genes; blue: down-regulated genes). C. GESA analysis on the top 5 gene sets of up-regulated genes (upper panel) and down-regulated genes (lower panel). D. KEGG analysis of the signaling pathways enriched by the up-regulated genes (left panel) and down-regulated genes (right panel). E. GO analysis of the BP, CC, and MF enriched by the up-regulated genes (left panel) and down-regulated genes (right panel).
Different from those in A549 cells, there were 7,845 DEGs in H1650 cells post treatment of RC (Figure 3A; padj < 0.05, |logFC| > 1), with 4,220 up-regulated genes and 3,625 down-regulated genes (Figure 3B). Noteworthily, the top ten up-regulated DEGs also included C11orf96 and RMRP, whereas the significantly down-regulated genes only encompassed ZBTB6, NUFIP1, PTPN20, etc. (Table 2). As GSEA data suggested, the up-regulated genes were enriched in fructose and mannose metabolism, VEGF signaling pathway and lysosomal pathway; similar to those in A549 cells post treatment of RC, the down-regulated genes in H1650 cells were also enriched in cell cycle, DNA replication, RNA degradation and splicing pathways (Figure 3C). In addition, KEGG pathway enrichment analysis indicated that the up-regulated genes were also apparently enriched in multiple pathways of neurodegenerative disease (eg. Alzheimer's disease), whereas the down-regulated genes were related to cell cycle, protein processing in endoplasmic reticulum and cellular senescence (Figure 3D). Furthermore, it was discovered by GO function enrichment analysis that BP, CC and MF enriched by up-regulated genes were biosynthesis of ribonucleoprotein complex, vacuolar membrane, and molecular adaptation activity, respectively; consistent with those in A549 cells, in H1650 cells, BP, CC and MF enriched by the down-regulated genes were biosynthesis of ribonucleoprotein complex, chromosome regions and enzyme-catalyzed activities acting on RNAs, respectively (Figure 3E).
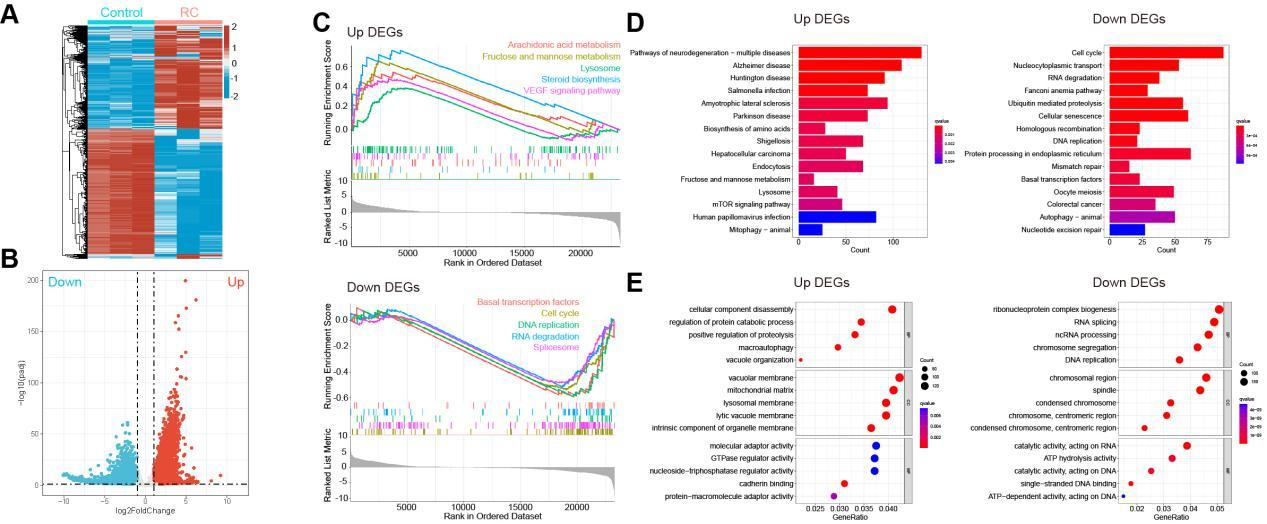
Figure 3 Transcriptomics analysis of gene changes in H1650 cell line treated with RC. H1650 cell line was treated with RC water extract (0.5 mg/mL). A. The heat map of DEGs (padj < 0.05, |logFC| > 1; red: up-regulated genes; blue: down-regulated genes). B. Volcano map of DEGs (red: up-regulated genes; blue: down-regulated genes). C. GESA analysis on the top 5 gene sets of up-regulated genes (upper panel) and down-regulated genes (lower panel). D. KEGG analysis of the signaling pathways enriched by the up-regulated genes (left panel) and down-regulated genes (right panel). E. GO analysis of BP, CC and MF enriched by the up-regulated genes (left panel) and down-regulated genes (right panel).
Table 2 DEGs with significant changes in expression after the treatment of RC.
| Serial number | A549 | H1650 | ||
|---|---|---|---|---|
| Up-regulated genes | Down-regulated genes | Up-regulated genes | Down-regulated genes | |
| 1 | C11orf96 | FANCB | MIR3648-1 | ZBTB6 |
| 2 | PRSS22 | ZNF714 | RMRP | NUFIP1 |
| 3 | RMRP | SERPINI1 | ENSG00000277437 | AASDH |
| 4 | C1QL2 | NOG | RN7SKP203 | MTUS1 |
| 5 | RHCG | C21orf91 | MAGED4B | TSHZ1 |
| 6 | RRAD | FDXACB1 | DIO3OS | PTPN20 |
| 7 | BIK | SOX21 | MIF | AOX1 |
| 8 | HCAR2 | ENSG00000273702 | MVD | CD36 |
| 9 | ACHE | FAM83A | C11orf96 | VCPKMT |
| 10 | DEPP1 | TAF1A-AS1 | TAFA5 | IFT88 |
3.3 Analysis on the effect of RC on intersecting DEGs in A549 and H1650 cells
For further understanding the similarity of molecular mechanism for RC in repressing the proliferation of A549 and H1650 cells, DEGs in A549 and H1650 cells treated with RC were subjected to Venn diagram analysis, where there were 4,490 intersecting DEGs (Figure 4A). Notably, there were 4,679 DEGs with the same change trends in these two cell lines, including 2,495 up-regulated genes and 2,184 down-regulated genes (Figure 4B). KEGG analysis showed that the up-regulated genes were enriched in multiple pathways of neurodegenerative disease (eg. Alzheimer's disease) and human papillomavirus infection, while the down-regulated genes were mainly involved in pathways of cell cycle, spliceosome and nucleocytoplasmic transport (Figure 4C). In GO enrichment analysis, BP encompassed DNA replication, chromosome isolation, non-coding RNA processing, etc. (Figure 4D).
Considering that cell cycle and DNA replication were established to be the key pathways for the regulation of cell proliferation, 82 DEGs involving these pathways were imported into STRING database for analysis. Subsequently, a protein-protein interaction (PPI) network with 638 interaction lines was obtained (Figure 4E), from which hub genes, including cyclin-dependent kinases (CDKs) CDK1 and CDK2, CDK regulatory factors CCNA2 and CCNB1, checkpoint kinase 1 (CHEK1) and cell division cycle 6 (CDC6), were recognized (Figure 4F).
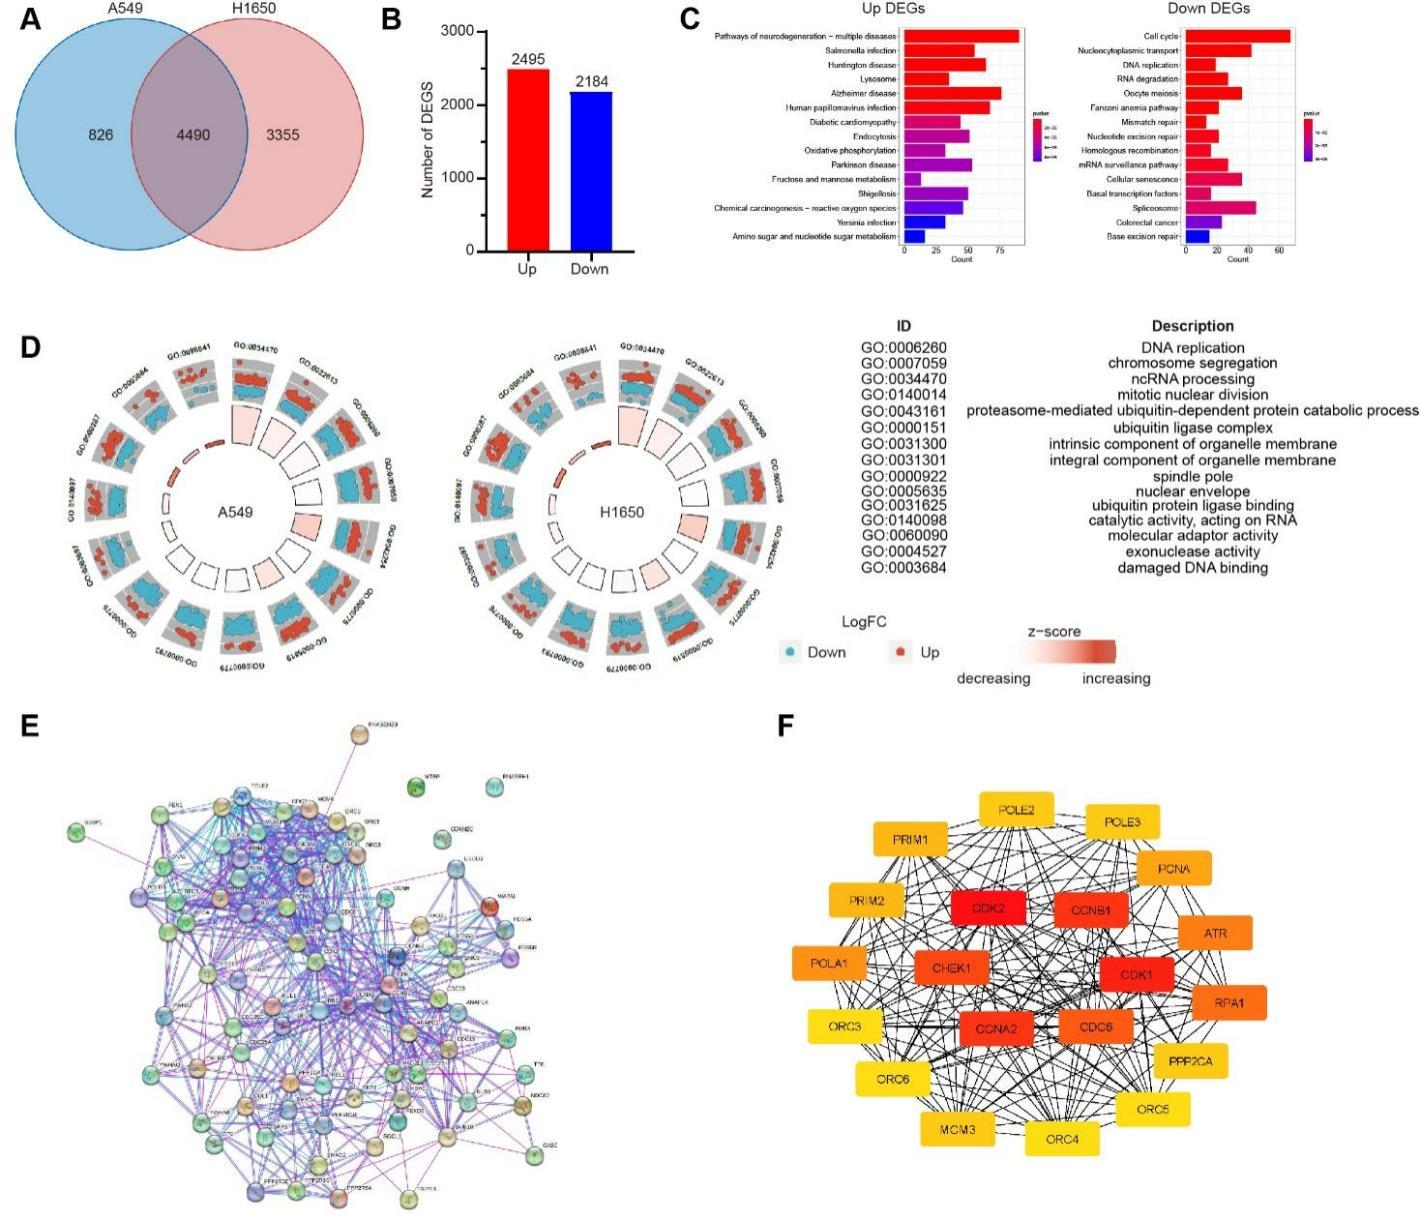
Figure 4 Conjoint analysis of gene changes in A549 and H1650 cell lines treated with RC. A549 and H1650 cell lines were treated with RC water extract (0.5 mg/mL). A. Venn diagram analysis of DEGs. B. The number of genes with same change trend in intersecting DEGs. C. KEGG analysis of signaling pathways enriched by the up-regulated genes (left panel) and down-regulated genes (right panel) in intersecting DEGs. D. GO analysis on BC of intersecting DEGs enriched in A549 cells (left) and H1650 cells (right) (red: up-regulated genes; blue: down-regulated genes). E. Analysis on the PPI network of intersecting DEGs related to cell cycle and DNA replication. F. The top 20 hub genes ranked by the Degree value in PPI network and their interactions.
3.4 Transcriptomic analysis on the mechanism of RC and gefitinib in repressing the proliferation of A549 and H1650 cells
Distinct from those in cells treated with RC alone, there were 7,246 DEGs in A549 cell line and 6,678 DEGs in H1650 cell line after the combined treatment of RC (0.5 mg/mL) and gefitinib (10 μM), with 4,928 intersecting DEGs (Figure 5A). Besdies, there were 5,221 DEGs with the same change trends in these two cell lines, including 2,683 up-regulated genes and 2,538 down-regulated genes (Figure 5B). As demonstrated by KEGG analysis (Figure 5C) and GO analysis (Figure 5D), the signaling pathways and BP of intersecting DEGs obtained in cells treated with RC and gefitinib were similar to those in cells treated with RC alone. In the PPI nework (Figure 5E; 806 interaction lines) of 88 DEGs related to cell cycle and DNA replication, CDK1, CDK2, CCNA2, CCNB1 and CDC6 occupied the core positions (Figure 5F).
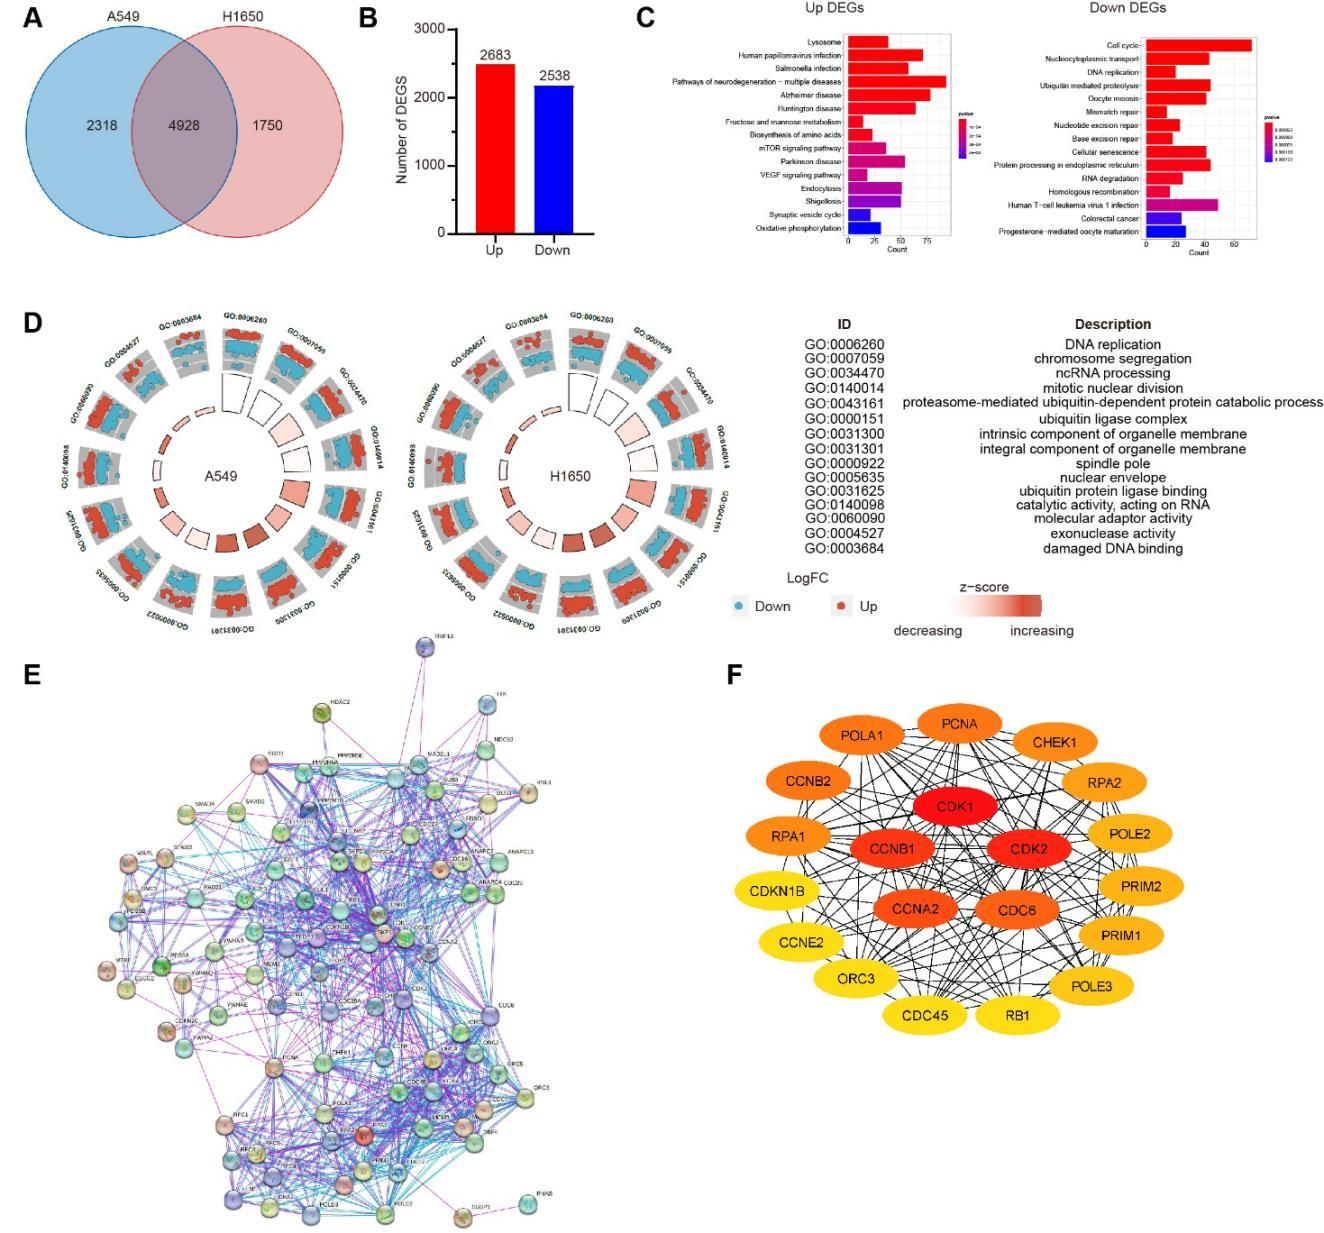
Figure 5 Conjoint analysis of gene changes in A549 and H1650 cell lines treated with RC. A549 and H1650 cell lines were treated with RC water extract (0.5 mg/mL) and gefitinib (10 μM). A. Venn diagram analysis of DEGs. B. The number of genes with same change trend in intersecting DEGs. C. KEGG analysis of the signaling pathways enriched by the up-regulated genes (left panel) and down-regulated genes (right panel) in intersecting DEGs. D. GO analysis on BC of intersecting DEGs enriched in A549 cells (left) and H1650 cells (right) (red: up-regulated genes; blue: down-regulated genes). E. Analysis on the PPI network of intersecting DEGs related to cell cycle and DNA replication. F. The top 20 hub genes ranked by the Degree value in PPI network and their interactions.
3.5 RC inhibited A549 and H1650 cell clycle transformation
Herein, qPCR was harnessed to further validate the effects of RC on the expression levels of genes related to cell cycle. As a result, RC markedly suppressed the expression levels of CDK1, CDK2, CCNA2, CCNB1 and CDC6 in A549 and H1650 cells (Figure 6A,6B). More importantly, the treatment of gefitinib alone barely affected the expression levels of above genes related to cell cycle, yet the combined treatment of gefitinib and RC significantly repressed the expression levels of these genes (Figure 6A,6B), which may also be an important reason for the synergistic effects of gefitinib and RC on repressing cell proliferation.
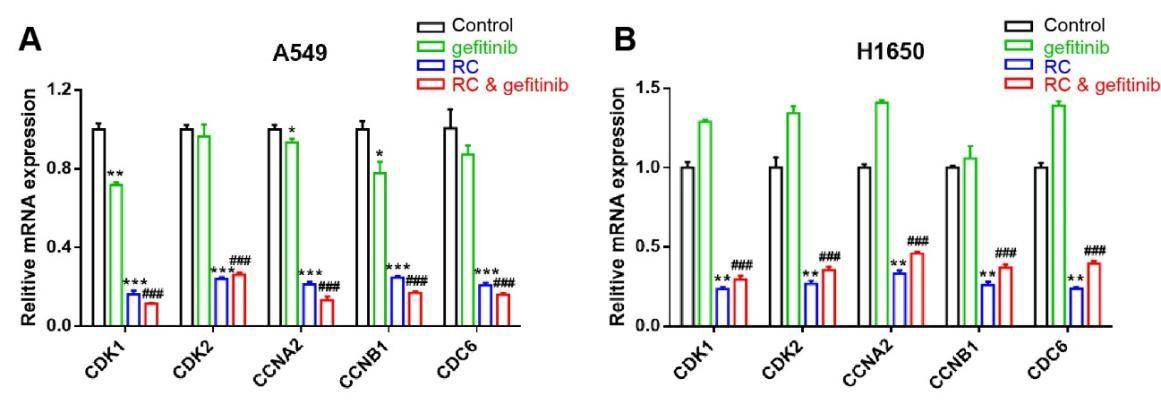
Figure 6 RC inhibited the expression levels of key genes involved in cell proliferation regulation. The effects of RC (0.5 mg/mL) and gefitinib (10 μM) alone or together on the expression levels of CDK1, CDK2, CCNA2, CCNB1 and CDC6 in A. A549 cells and B. H1650 cells. RC group vs. control group, *p < 0.05, **p < 0.01, ***p < 0.001; RC & gefitinib group vs. gefitinib group, ###p < 0.001.
4 Discussion
EGFR is one of the common mutant genes in NSCLC, and exists in 40%~60% of Southeast Asian patients and 10%~20% of Caucasian patients [21]. EGFR is a member of HER family which also includes HER2, HER3 and HER4. EGFR can form dimers with other members of HER family when its extracellular domain binds to its ligand, and undergoes autophosphorylation at key tyrosine residues, thereby activating various downstream signaling pathways such as AKT/PKB and MAPK signaling pathways, and regulating multiple cell functions such as proliferation, survival and apoptosis [22]. In-frame EGFR exon 19 deletion (19del), especially E746-A750del, is a common activating mutation [23]. Given the fact that this mutation confers the adenosine triphosphate pocket (ATP)-binding pocket of EGFR a higher affinity with EGFR-TKIs, NSCLC patients harboring this mutation, like wild-type EGFR patients, exhibit a higher sensitivity to EGFR-TKIs treatment, with a higher response rate and longer median survival [18]. Despite that EGFR mutation-positive NSCLC patients have a higher response to first-generation EGFR-TKIs, in the clinical practice, there are merely 5% of patients with a tumor shrinkage rate over 90% after treatment with EGFR-TKIs; in addition, the majority of patients develop the acquired resistance within 9~14 months of treatment [21]. Hence, it is of great significance to formulate more effective strategies for ameliorating the resistance to EGFR-TKIs in NSCLC patients.
RC is a dried twig of Cinnamomum Cassia in the Lauraceae family, and is an important multifunctional TCM drug. In Treatise on Febrile and Miscellaneous Diseases, a classic of TCM work, there are more than 70 prescriptions with RC, where most prescriptions have satisfactory effects on treating assorted malignant tumors including lung cancer. In in-vitro study, RC water extract has also been attested to hinder the proliferation of diverse cancer cell lines, including human NSCLC cells (A549), human colorectal carcinoma cells (HT-29, HCT-15 and SW480), human breast carcinoma cells (MCF7) and human hepatocellular carcinoma cells (HepG2) [8,9,24]. In this study, we testified that RC could significantly inhibit the ability of two human NSCLC cell lines A549 and H1650 to proliferate, where A549 cells had normal EGFR, yet H1650 cells contained DelE746-A750. In addition, the combined treatment of RC and gefitinib exerted a stronger effect on repressing the proliferation of NSCLC cells than the treatment of RC or gefitinib alone. All of these findings hint that the inhibitory effect of RC on the proliferation of NSCLC cells may not dependent on EGFR mutation, and RC has a synergistic effect with gefitinib on repressing the proliferation of NSCLC cells.
To date, the regulatory mechanism of RC in inhibiting the proliferation of tumor cells has not been fully understood. The existing researches have uncovered several potential mechanisms, including the promotion of cell apoptosis, regulation of cell cycle, anti-angiogenesis and anti-inflammation [5,6]. Herein, to further unveil the specific molecule of RC in restraining the proliferation of NSCLC cells, transcriptomic analysis was harnessed, from which the repressive effect of RC on the proliferation of A549 and H1650 cells was found to be achieved by multiple pathways and targets. Notably, the expression levels of genes related to cell cycle and DNA replication were conspicuously down-regulated, signifying that modulating cell cycle is one of the pivotal mechanisms for RC to inhibit the proliferation of NSCLC cells. More importantly, it seems that gefitinib barely affects the suppressing impact of RC upon the expression levels of these genes. In fact, dysregulation of the cell cycle is known to be a key cause of abnormal proliferation of tumor cells, and many TCM drugs including RC have been attested to hamper the abnormal proliferation of tumor cells by affecting the multiple key molecules in cell cycle pathways [8,9,24,25]. For instance, Pan et al. have found that RC water extract can repress the AKT/ERK signaling pathway to promote the colon cancer cell cycle arrest and apoptosis [9]. In addition, the research by Jiang et al. has demonstrated that Guizhi Fuling Pills (containing RC, Poria Cocos, Cortex Moutan, Red Paeony Root and Peach Kernel) can down-regulate the expression levels of cell cycle-realted regulatory molecules (CCNA2 and CDK2), EGFR gene and protein, and hamper the proliferation of human breast carcinoma cells MCF7 [25]. In this study, the key targets of RC in regulating cell proliferation, including cyclin-dependent kinases (CDK1/2), cell cycle protein (CCNA2 and CCNB1) and cell division cycle protein (CDC6), were further deterimined. Notably, CDK1/2 is one of the important member of protein kinase family, playing a critical part in modulating the transformation of key cell cycle such as G1-S phase and G2-M phase. Besides, the change in the activity of CDK1/2 has been deemed as a marker for the malignant proliferation of tumor cells. However, it remains to be determined how RC regulates those genes at the molecular level by future in vitro/in vivo experiment. Moreover, because of its constituent elements being complex, it’s still very neccesseray for future studies to identify the key active ingredient of RC that play a leading role in inhibiting NSCLC cell proliferation.
Collectively, in this study, the suppressive effects of RC on key genes for the proliferation of cell lines under different EGFR gene conditions are revealed by transcriptomic techniques, and further validated by qRT-PCR, providing new clues for the full understanding on molecular targets and pharmaceutical mechanism of RC in affecting the function of NSCLC, and laying new theoretical foundation for the clinical application of RC in treating the resistance to EGFR-TKIs in NSCLC patients.
Back Matter
Acknowledgments
Not applicable.
Conflicts of Interest
Tao Wang and Hui Yuan are employed by Dian Diagnostics Group Co., Ltd., Hangzhou, Zhejiang Province. All authors declare that the research was conducted in the absence of any commercial or financial relationships that could be construed as a potential conflict of interest.
Author Contributions
N.H.J. designed the study. S.Y.W. wrote the manuscript and performed the practical work. J.Y.W., H.Y., J.Z.X., and H.Z. performed the acquisition of data and analysis and interpretation of data. This manuscript was revised critically for important intellectual content by T.W. and N.H.J. All authors contributed to the article and approved the submitted version.
Ethics Approval and Consent to Participate
Not applicable.
Funding
This study is supported by funding from Traditional Chinese Medicine Science and Technology Planning Project of Zhejiang Province (Grant NO. 2021ZB295).
Availability of Data and Materials
The analyzed data sets generated during the study are available from the corresponding author on reasonable request.
Supplementary Materials
Not applicable.
References
- Zheng RS, Zhang SW, Sun KX, et al. Cancer statistics in China, 2016. Zhonghua Zhong Liu Za Zhi 2023; 45(3): 212-220.
- Guo H, Li H, Zhu L, et al. "How long have I got?" in stage IV NSCLC patients with at least 3 months up to 10 years survival, accuracy of long-, intermediate-, and short-term survival prediction is not good enough to answer this question. Frontiers in Oncology 2021; 11: 761042.
- Chen R, Zhao D, Wang LN. Mechanism and strategies on drug resistance of non-small cell lung cancer to EGFR-TKI. Cancer Research on Prevention and Treatment 2017; 44(03): 225-230.
- Jackman D, Pao W, Riely GJ, et al. Clinical definition of acquired resistance to epidermal growth factor receptor tyrosine kinase inhibitors in non-small-cell lung cancer. Journal of Clinical Oncology 2010; 28(2): 357-360.
- Qian CG, Jin L, Zhu LP, et al. Study on chemical constituents, antitumor and anti-inflammatory activities of Cinnamomi Ramulus. Chinese Traditional and Herbal Drugs 2022; 53(1): 31-40.
- Liu J, Zhang Q, Li RL, et al. The traditional uses, phytochemistry, pharmacology and toxicology of Cinnamomi Ramulus: a review. Journal of Pharmacy and Pharmacology 2020; 72(3): 319-342.
- Carvalho AA, Andrade LN, de Sousa ÉB, et al. Antitumor phenylpropanoids found in essential oils. BioMed Research International 2015; 2015: 392674.
- Li J, Huang HY, Lin YC, et al. Cinnamomi Ramulus inhibits cancer cells growth by inducing G2/M arrest. Frontiers in Pharmacology 2023; 14: 1121799.
- Pan B, Xia Y, Gao Z, et al. Cinnamomi Ramulus inhibits the growth of colon cancer cells via Akt/ERK signaling pathways. Chinese Medicine 2022; 17(1): 36.
- Gong NJ, Liang H. Effects of Buyuan Decoction and Guizhi Fuling Pills on immune function of patients with middle and advanced non-small cell lung cancer. Anti-Tumor Pharmacy 2020; 10(2): 232-236.
- Mei Z, Zhu FY, Ren Y, et al. Clinical experience on the application of modified Guizhi Fuling pills in tumors. World Latest Medicine Information 2018; 18(33): 137.
- Wang XH, Yu MW, Wang XM. Analysis of WANG Xiao-min's treatment thoughts of malignant tumors with Chaihu Guizhi Decoction. Journal of Hubei University of Chinese Medicine 2023; 25(1): 116-118.
- Huo XK, Jia YT. Overview of the clinical application of Huangqi Guizhi Wuwu Decoction in the treatment of tumors. Journal of Oncology in Chinese Medicine 2022; 4(3): 71-75.
- Han L, Guo X, Bian H, et al. Guizhi Fuling Wan, a traditional Chinese herbal formula, sensitizes cisplatin-resistant human ovarian cancer cells through inactivation of the PI3K/AKT/mTOR pathway. Evidence-Based Complementary and Alternative Medicine 2016; 2016: 4651949.
- Park GH, Song HM, Park SB, et al. Cytotoxic activity of the twigs of Cinnamomum cassia through the suppression of cell proliferation and the induction of apoptosis in human colorectal cancer cells. BMC Complementary Medicine and Therapies 2018;18(1): 28.
- Love MI, Huber W, Anders S. Moderated estimation of fold change and dispersion for RNA-seq data with DESeq2. Genome Biology 2014; 15(12): 550.
- Yu G, Wang LG, Han Y, et al. clusterProfiler: an R package for comparing biological themes among gene clusters. OMICS 2012; 16(5): 284-287.
- Liberzon A, Birger C, Thorvaldsdóttir H, et al. The Molecular Signatures Database (MSigDB) hallmark gene set collection. Cell Systems 2015; 1(6): 417-425.
- Szklarczyk D, Gable AL, Lyon D, et al. STRING v11: protein-protein association networks with increased coverage, supporting functional discovery in genome-wide experimental datasets. Nucleic Acids Research 2019; 47(D1): D607-D613.
- Livak KJ, Schmittgen TD. Analysis of relative gene expression data using real-time quantitative PCR and the 2−ΔΔCT method. Methods 2001; 25(4): 402-408.
- Hsu WH, Yang JC, Mok TS, et al. Overview of current systemic management of EGFR-mutant NSCLC. Annals of Oncology 2018; 29(suppl_1): i3-i9.
- Sigismund S, Avanzato D, Lanzetti L. Emerging functions of the EGFR in cancer. Molecular Oncology 2018; 12(1): 3-20.
- Shigematsu H, Lin L, Takahashi T, et al. Clinical and biological features associated with epidermal growth factor receptor gene mutations in lung cancers. Journal of the National Cancer Institute 2005; 97(5): 339-346.
- Sun PD, Sun D. Mechanisms of Ramulus Cinnamomi water extract in inducing cell cycle progression and apoptosis of human colorectal cancer cells SW480. Chinese Journal of Gerontology 2020; 40(20): 4396-4399.
- Jiang SH, Li L, Wu YS, et al. Mechanism of Guizhi Fuling Wan in inhibiting proliferation of human breast cancer MCF-7 cells. Chinese Journal of Experimental Traditional Medical Formulae 2018; 24(15): 132-136.