Main Text
1 Introduction
Andrographis paniculata (A. paniculata) is a traditional Chinese medicinal material that can clear heat, remove toxin, cool blood and disperse swelling, and can be used to treat common cold disease with fever, swollen sore throat, sores on the mouth and tongue, pertussis and cough, diarrhea and dysentery, heat stranguria and astringent pain, welling-abscess swellings and sores, as well as snake and insect bite [1]. Modern pharmaceutical research revealed that A. paniculata has several kinds of chemical components, including diterpene lactones, flavones, phenylpropanoids, iridoids, sterols, and alkaloids [2]. Diterpene lactones, which are the main active components in A. paniculata, have various pharmacological activities, such as anti-inflammation, anti-bacteria, anti-virus and the potential for treating cardiovascular diseases [2,3]. Among them, andrographolide (AP) and dehydroandrographolide (DAP), which are the primary diterpene lactones in A. paniculata, have been widely applied in quality evaluation of A. paniculata medicinal material and its relevant products [4-6]. Previous reports have used high performance liquid chromatograph (HPLC) [7], thin-layer chromatography [8], micellar electrokinetic capillary chromatography [9], infrared spectroscopy [7], and nuclear magnetic resonance spectroscopy [10] to develop methods for quantifying the levels of AP and DAP in A. paniculata. Notably, HPLC is recognized as the standard method for determining component content of A. paniculata according to the Chinese Pharmacopoeia [1], and is the most widely used method in A. paniculata industry. However, the reported HPLC methods about A. paniculata have problems in long-time sample extraction and HPLC separation, as well as excessive consumption of reference components and organic reagents. For instance, Chinese Pharmacopoeia (2020 edition) [1] prepared samples via ultrasonic extraction, with extraction for 30 min, liquid phase analysis for 65 min, and 158.8 mL methanol consumed; Kasemsumran et al. [7] prepared samples by soxhlet extraction, with 210 min of extraction, 16 min of liquid phase analysis, and 117.2 mL methanol consumption; Liu et al. [11] adopted cold impregnation method to prepare biocompatible microemulsion sample, which took 4 days for extraction and 46 min for liquid phase analysis, and consumed 15.5 mL acetonitrile. The above methods all spend over 90 min of analytical time, and require 2 reference components for quantification, which is unfavorable for rapid selection and detection of main active components in A. paniculata and its relevant products.
Matrix solid-phase dispersion (MSPD) can achieve multistep elution by different solvents and separate components with different polarity from traditional Chinese medicinal materials, which has advantages of easy-to-use and rapid operation, as well as material and reagent saving, and has been extensively used in rapid extraction of active components in traditional Chinese medicinal materials [12-14]. Core-shell column has high column efficiency, low back pressure, and rapid analysis, which can realize rapid analysis on conventional HPLC similar to ultra-high performance liquid chromatograph (UPLC). This makes it a suitable liquid chromatography method for rapid analysis and detection in traditional Chinese medicine industry [14-17]. The principle of detection, analysis and quantification of HPLC-ultraviolet (HPLC-UV) is that the compounds are separated by an HPLC column, and UV detector determines the content of the analyte according to the response at a specific wavelength [18,19]. To ensure the sensitivity of analysis method, the maximum absorption wavelength of AP and DAP is usually used as the detection wavelength. However, AP and DAP exhibit different responses to UV under the maximum absorption wavelength, so that correction factors are required to quantify multiple compounds using a single reference component [20]. If AP and DAP have the same UV absorption wavelength as the detection wavelength, it is possible to determine the content of AP and DAP using a single reference component without the need for correction factors. Hence, the combination of MSPD extraction, core-shell column analysis and HPLC-UV at equal absorption wavelength (EAW) allows for the rapid determination of main components in A. paniculata with relatively less consumption of reference components and materials.
This study employed MSPD extraction, core-shell column analysis, and HPLC-UV at EAW to develop a rapid analytical method for the determination of AP and DAP using a single reference component. The developed method is valuable for improving quality evaluation of A. paniculata and its relevant products.
2 Experimental instruments, reagents and medicinal materials
2.1 Experimental instruments
Agilent 1260 II HPLC System (Agilent Technologies, USA), Agilent Poroshell 120 EC-C18 column (50 mm × 4.6 mm, 2.7 μm, Agilent Technologies), XPE205DR Electronic Analytical Balance (1/100,000, METTLER TOLEDO, USA), Milli-Q Ultrapure Water System (Merck Millipore, Germany), P300H Ultrasonic Apparatus (ELMA, Germany) and Tube-Mill 100 (IKA, Germany) were prepared in advance.
2.2 Experimental reagents
AP reference components (98% content, PS011603, PUSH BIO-TECHNOLOGY Co., Ltd, Chengdu, China), DAP (98% content, PS10370, PUSH BIO-TECHNOLOGY Co., Ltd), Octadecyl silane (ODS) chemically bonded to porous silica (16412, YMC Co., Ltd, Japan), methanol (880608, HPLC grade, Kluthe Chemical Industry Co., Ltd, Shanghai, China), and acetonitrile (880502, HPLC grade, Kluthe Chemical Industry Co., Ltd) were purchased. Ultrapure water was purified by Milli-Q purification system.
2.3 Experimental medicinal materials
Ten batches (S1-S10) of A. paniculata medicinal materials were collected from Dongguan city, which were authenticated as the dry aerial parts of A. paniculata by Prof. Zhengming Qian.
3 Experimental methods
3.1 Chromatographic condition
An Agilent 1260 II HPLC System was employed. The HPLC analysis was performed using an Agilent Poroshell 120 EC-C18 column (50 mm × 4.6 mm, 2.7 μm) with a water-acetonitrile mobile phase, gradient elution for 0-1.5 min (28% B), 1.5-2 min (28%~40% B), and 2-5 min (40% B), a flow rate of 1.5 mL/min, column temperature at 25 ℃, 5 μL sample, 240 nm detection wavelength and 2 nm bandwidth.
3.2 Preparation of reference component solution
The mixed stock solution, containing 4.4100 mg/mL AP and 4.3982 mg/mL DAP, was prepared in methanol, and then the solution was diluted to the desired concentrations by 40% methanol.
3.3 Preparation of sample solution
Solid phase extraction column: Appropriate amount of ODS filler suspended in methanol was added into a solid phase extraction column with a radius of 0.4 cm, settled and knocked to a final height of 1 cm. Later, a section-sized filter plate was placed over the filler, and the methanol was replaced by 2 mL 40% methanol eluent which was even with the filler transection.
A. paniculata medicinal materials were crushed and passed through a No.3 sieve. 30 mg powder was collected, transferred into solid phase extraction column and spread flat. A filter paper of the same size as the cross-sectional section of the column was added over the sample powder. 2 mL 40% methanol was applied to wash off impurities, 2 mL methanol was used to elute target analyte. The target analyte eluent was collected, diluted with methanol to a final volume of 5 mL, and filtered through a 0.45 μm microfiltration membrane to obtain the test sample solution.
3.4 Method validation
3.4.1 Specificity
When preparing the sample solution, the solid phase extraction column without sample powder was taken to prepare a blank solution according to methods outlined in section "3.3". The blank solution, the sample solution, and the reference component solution were analyzed based on the chromatographic conditions described in section "3.1".
3.4.2 Linearity
A series of concentrations of reference compound solutions were prepared for evaluation of linearity. The AP (2.4255-97.0200 μg/mL) and DAP (2.4190-96.7613 μg/mL) were analyzed by HPLC. The standard curve was plotted with the peak area as y-axis (Y) and the concentration of the reference component as x-axis (X) to obtain the linear regression equation, and the limit of quantification (LOQ) was determined by identifying the corresponding concentration at a signal-to-noise ratio of 10:1.
3.4.3 Precision
The mixed reference component solution, containing AP at 24.2550 μg/mL and DAP at 24.1903 μg/mL, was continuously and repeatedly analyzed six times within one day in accordance with the chromatographic conditions outlined in section "3.1". The relative standard deviation (RSD) of peak area was calculated to evaluate the intraday precision of the developed method. Next, the mixed reference component solution was harvested and tested twice per day for 3 consecutive days, using the chromatographic conditions described in section "3.1". The RSD of peak area was calculated to evaluate the interday precision of the developed method.
3.4.4 Repeatability
Six samples from the same batch (S1) weighing 30 mg each were prepared. The sample solution was prepared based on the methods outlined in section "3.3" and analyzed using the chromatographic conditions described in section "3.1". The RSD of the contents was used to assess the repeatability.
3.4.5 Recovery
The known amounts of A. paniculata sample (S1) was subjected to a recovery test. In detail, 15 mg samples were transferred into solid phase extraction column, and eluted by AP and DAP mixed reference component solution that had been diluted in 2 mL 40% methanol. Next, 2 mL methanol was applied to elute target analyte. The eluent was diluted to a total volume of 5 mL using methanol, and filtered through a 0.45 μm microfiltration membrane. The sample was prepared into 6 parts and analyzed according to the chromatographic conditions outlined in section "3.1" to calculate the recovery rate and RSD of AP and DAP.
3.4.6 Stability
The A. paniculata test sample solution (S1) was stored at room temperature, and analyzed at 0, 4, 8, 12, 16, 20 and 24 hours after the extraction. Next, the RSD of peak area was calculated.
4 Results and discussion
4.1 Optimization of extraction condition
In Chinese Pharmacopoeia (2020 edition), the A. paniculata was extracted by ultrasonic extraction with 40% methanol for 30 min. However, this method is time-consuming, and many interfering components exist due to the complex components in A. paniculata medicinal materials, especially AP that is prone to interference by miscellaneous peaks [21]. MSPD is a newly developed sample pretreatment technology in recent years, which can effectively remove interferences from analytes, and shorten the sample extraction process. Owing to simple operation, time-saving, and labor-saving advantages, MSPD has been widely applied in the separation and purification of active components in traditional Chinese medicinal materials [12-14]. Therefore, this study used the MSPD with ODS as the filler to prepare sample solution, and assessed the separation efficiency of different methanol eluent (30% methanol, 40% methanol, 50% methanol and methanol) on impurities and target analytes. 4 mL at each concentration was eluted (eluting in 2 times, 2 mL/time). The results (Figure S1) indicated that 4 mL 30% methanol did not completely remove impurities, while 4 mL 40% methanol can completely remove impurities and without elution of target analytes. Similarly, 4 mL 50% methanol also effectively remove impurities, but with partial elution of target analytes. Besides, further study indicated that most impurities were removed by the first 2 mL 40% methanol, and all target analytes could be obtained after the first use of 2 mL elution with methanol. Thus, our experiments finally selected 2 mL 40% methanol to remove impurities first, and then eluted target analytes by 2 mL methanol. Compared with Chinese Pharmacopoeia method (2020 edition), this method reduces the consumption of organic solvent, and shortens the time for sample preparation. In addition, impurity removal by MSPD contributes to extending the working life of HPLC column, which is suitable for the industrialized testing of A. paniculata.
To obtain UV EAW of AP and DAP, the UV spectrophotometer was used to get the UV spectrum of AP and DAP by scanning two reference solutions at the same concentration (0.0220 mg/mL) from 200 to 350 nm wavelength. According to the data (Figure S2A), AP and DAP had two EAWs at 219 nm and 240 nm in UV spectrum. After verification by HPLC, it was found that the interference peak appeared before DAP chromatographic peak at 219 nm wavelength and the baseline was instable, while there was no interference peak before and after AP and DAP chromatographic peaks with stable baseline at 240 nm wavelength (Figure S2B). Next, the effects of 240 ± 1 nm wavelength and different bandwidths (1, 2, 4 and 8 nm, =240 nm) on target analytes were evaluated. The outcomes suggested that AP and DAP shared the most similar peak area at a wavelength of 240 nm, and the impact on peak area was minimal at a bandwidth of 2 nm (Table S1 and Table S2). Finally, the HPLC-UV at EAW was confirmed to be 240 nm and the bandwidth was 2 nm.
4.2 Optimization of HPLC conditions
In the Chinese Pharmacopoeia (2020 edition), HPLC is used to detect the contents of AP and DAP in A. paniculata, and 65 min is necessary for analysis by conventional HPLC, which is time-consuming [1]. Core-shell column is a kind of rapid HPLC column, which has the advantages of high column efficiency and low back pressure. Compared with common HPLC column, core-shell column can evidently shorten analysis time, improve separation efficiency, and elevate sensitivity. On this basis, core-shell column has been currently extensively applied in rapid analysis of chemical components in traditional Chinese medicinal materials [14,16,17]. Accordingly, to achieve rapid chromatographic separation, this study selected Agilent Poroshell 120 EC-C18 (50 mm × 4.6 mm, 2.7 μm) column to detect the contents of AP and DAP in A. paniculata. Meanwhile, the separation efficiency of different flow rates (1.4, 1.5, and 1.6 mL/min) and column temperatures (20, 25, and 30 ℃) on target analytes was compared. The results (Figure S3) showed that the flow rate and column temperature did not significantly impact the separation of AP and DAP, thereby meeting the requirements for sample detection. Through comprehensive consideration, the final chromatographic conditions were set as follows: Agilent Poroshell 120 EC-C18(50 mm × 4.6 mm, 2.7 μm)column, water-acetonitrile mobile phase, gradient elution at a flow rate of 1.5 mL/min for 5 min, and column temperature set at 25 ℃. This method, compared with that in Chinese Pharmacopoeia (2020 edition), could greatly shorten analysis time, reduce detection cost, and lower organic solvent consumption.
4.3 Confirmation of EAW
Reportedly, the external standard method (ESM) is often utilized to test the contents of AP and DAP with two reference components for quantification, which has the problems of excessive consumption of reference components and complicated preparation of reference solution [7,11]. The EAW detection method is to find two reference solutions with the same UV absorption wavelength as HPLC detection wavelength. At this wavelength, the UV response to two reference solutions are similar, and the content detection of two analytes can be achieved through either reference solution without conversion using additional correction factors [18,19].
To obtain UV EAW of AP and DAP, the UV spectrophotometer was used to get the UV spectrum of AP and DAP by scanning two reference solutions at the same concentration (0.0220 mg/mL) from 200 to 350 nm wavelength. According to the data (Figure S2A), AP and DAP had two EAWs at 219 nm and 240 nm in UV spectrum. After verification by HPLC, it was found that the interference peak appeared before DAP chromatographic peak at 219 nm wavelength and the baseline was instable, while there was no interference peak before and after AP and DAP chromatographic peaks with stable baseline at 240 nm wavelength (Figure S2B). Next, the effects of 240 ± 1 nm wavelength and different bandwidths (1, 2, 4 and 8 nm, λ=240 nm) on target analytes were evaluated. The outcomes suggested that AP and DAP shared the most similar peak area at a wavelength of 240 nm, and the impact on peak area was minimal at a bandwidth of 2 nm (Table S1 and Table S2). Finally, the HPLC-UV at EAW was confirmed to be 240 nm and the bandwidth was 2 nm.
4.4 Location of DAP chromatographic peak
With AP as the internal standard (S), the retention time difference and relative retention time of AP and DAP in different chromatographic columns (Agilent Poroshell 120 EC-C18 column (50 mm × 4.6 mm, 2.7 μm), Waters CORTECS C18 column (50 mm × 4.6 mm, 2.7 μm), ACE Ultra-Core Super C18 column (50 mm × 4.6 mm, 2.5 μm)) were investigated. The data (Table S3) indicated that AP greatly differed from DAP in terms of relative retention time with RSD of 13.77%, signifying that the relative retention time was not suitable for peak localization. Nevertheless, the RSD of the retention time was 2.08% with slight fluctuation, which proved that the DAP is suitable for determining the peak localization.
4.5 Method validation
The current method was validated from the aspects of specificity, LOQ, precision, accuracy, repeatability, and stability.
The specificity detection results revealed that the blank solution had no interference at the peak positions of AP and DAP, and the resolution of two analytes was greater than 1.5, manifesting the good specificity. The linearity detection outcomes indicated that both AP and DAP exhibited good linearity within their concentration ranges (r ≥ 0.9999), with LOQ of 80.85 μg/g and 80.63 μg/g, respectively (Table 1 and Figure S4). The RSDs of intraday and interday precision were less than 1.00%. The RSD of repeatability was less than 2.00% (Table S4). The sample solution was stable within 24 h (RSD < 1.50%) (Table S5).
In accordance with the recovery test results (Table 2), the recovery rates of AP and DAP were 99.89%-104.26% and 97.26%-102.46%, respectively. The average recovery rates of AP and DAP were 102.80% (RSD = 1.54%) and 100.70% (RSD = 1.91%), respectively.
Table 1 The linearity of AP and DAP.
| Analytes | Calibration curves | r | Linearity range (μg/mL) | LOQ (μg/g) |
|---|---|---|---|---|
| AP | Y=4.6127X-1.1758 | 0.99998 | 2.4255-97.0200 | 80.85 |
| DAP | Y=4.6145X-0.7086 | 0.99999 | 2.4190-96.7613 | 80.63 |
AP: andrographolide; DAP: dehydroandrographolide; LOQ: limit of quantification.
Table 2 The recoveries of AP and DAP.
| Analytes | Added/μg | Found/μg | Recovery/% | Average revovery/% | RSD/% |
|---|---|---|---|---|---|
| AP | 59.54 | 61.96 | 104.08 | 102.80 | 1.54 |
| 59.54 | 59.47 | 99.89 | |||
| 59.54 | 61.45 | 103.21 | |||
| 59.54 | 61.29 | 102.95 | |||
| 59.54 | 60.99 | 102.44 | |||
| 59.54 | 62.07 | 104.26 | |||
| DAP | 59.38 | 59.92 | 100.92 | 100.70 | 1.91 |
| 59.38 | 59.28 | 99.84 | |||
| 59.38 | 60.67 | 102.18 | |||
| 59.38 | 57.75 | 97.26 | |||
| 59.38 | 60.28 | 101.53 | |||
| 59.38 | 60.84 | 102.46 |
4.6 Sample analysis
A. paniculata samples (S1-S10) were used to prepare the sample solution based on the methods outlined in section "3.3" and analyzed using the chromatographic condition s described in section "3.1". The chromatograms of A. paniculata sample and reference component solutions were displayed in Figure 1. AP and DAP contents in samples were tested by the ESM that simultaneously adopted AP and DAP as references, and by the EAW method that only used AP as reference were listed in Table 3. Through calculating the relative mean deviation (RMD), it was found that RMDs of DAP content in 10 batches of A. paniculata samples by two methods were all less than 1.70%, indicating the two methods had no apparent difference, and the EAW method can be applied to detect the contents of the two analytes in A. paniculata. By means of HPLC-UV at EAW, AP and DAP contents in 10 batches of A. paniculata were 0.22%-0.94% and 0.21%-1.32%, respectively, with the total content of 0.65%-2.26%. This study also compared the analysis result of developed method and Chinese Pharmacopoeia method (Figure S5 and Table S6). The data of the two methods revealed that the average content of AP was 0.38 ± 0.01 %, and that of DAP was 0.42 ± 0.01%, with no difference in results (p > 0.05), indicating the feasibility of HPLC-UV at EAW.
In summary, the newly developed HPLC-UV at EAW has the advantages of simple and rapid operation, cost saving, good repeatability, and high specificity, which is appropriate for rapid quantification analysis of A. paniculata medicinal materials and its relevant products, and provides technical support for improving quality evaluation level of A. paniculata industry.
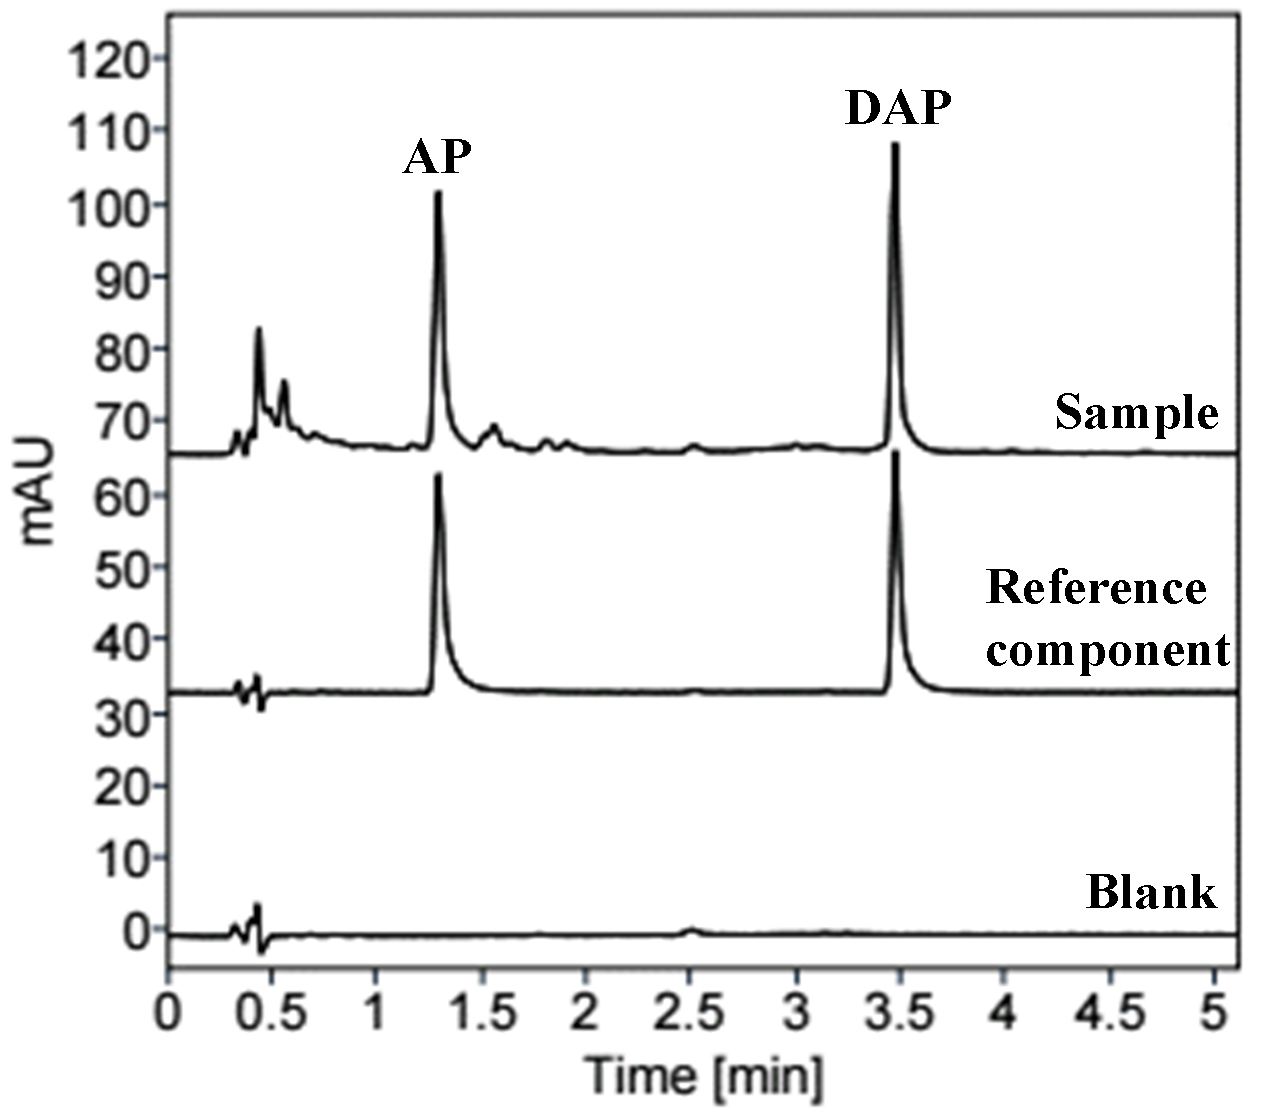
Figure 1 Chromatograms of blank solution, reference component solution and sample solution. (AP: andrographolide; DAP: dehydroandrographolide.)
Table 3 The contents of AP and DAP in A. paniculata.
| No. | AP (%) | DAP | ||
|---|---|---|---|---|
| EAW (%) | ESM (%) | RMD (%) | ||
| S1 | 0.39 | 0.43 | 0.43 | 0 |
| S2 | 0.44 | 0.21 | 0.21 | 0 |
| S3 | 0.26 | 0.83 | 0.82 | 1.21 |
| S4 | 0.35 | 0.95 | 0.94 | 1.06 |
| S5 | 0.35 | 1.05 | 1.04 | 0.96 |
| S6 | 0.74 | 1.24 | 1.22 | 1.63 |
| S7 | 0.45 | 1.06 | 1.05 | 0.95 |
| S8 | 0.22 | 0.62 | 0.61 | 1.63 |
| S9 | 0.94 | 1.32 | 1.30 | 1.53 |
| S10 | 0.85 | 1.07 | 1.06 | 0.94 |
AP: andrographolide; DAP: dehydroandrographolide; EAW: equal absorption wavelength; ESM: external standard method; RMD: relative mean deviation.
4.7 Comparisons of the developed and previously reported methods.
The comparison results of the developed and previously reported HPLC methods (methods 1-7) are exhibited in Table 4 [7,11,22-26]. The developed method is characterized by short extraction and analysis time, as well as less consumption of reference-components, harmful reagents, and materials.
Our developed method can achieve a rapid analysis with a total analysis time of 10 min, including 5 min for MSPD extraction of sample powder, and 5 min for HPLC analysis, through which the total analysis efficiency has been elevated by over 4 times. The total analysis time of previously reported method was more than 30 min. Method 1 needs 210 min for soxhlet extraction and 16 min for HPLC analysis; Method 2 needs 240 min for magnetic stirring extraction and 12 min for HPLC analysis; Method 3 needs 4 days to prepare biocompatible microemulsion sample using cold impregnation method and 46 min for HPLC analysis; Method 4 needs 40 min for ultrasonic extraction and centrifugation, as well as 20 min for HPLC analysis; Method 5 needs over 12 h to process samples and 7 min for HPLC analysis; Method 6 needs 30 min for ultrasonic extraction and centrifugation, as well as 10 min for HPLC and liquid chromatograph- mass spectrometer (LC-MS) analysis. Method 7 establishes a rapid analysis method by combining ultrasound and MSPD extraction with LC-MS system, but it still requires 11 min of total analysis time, since preparation of sample extracting solution by ultrasound spends time.
Besides, the developed method only needs one reference component to detect the contents of two components, while the previously reported methods all require two reference components. For instance, Method 7 achieves 11-min rapid detection of AP and DAP contents, but two reference components are necessary for quantification. By contrast, the currently developed method is simpler, because it decreases the number of reference components as well as the solvents and time for reference preparation.
Thirdly, the developed method consumes less samples and harmful reagents, by which only 30 mg sample powder is needed. However, previously reported methods require 100-1000 mg samples (Methods 1,2,4-7) and even 20 g samples (Method 3). The developed method consumes 8.5 mL harmful reagents, including 5.8 mL methanol for MSPD extraction and 2.7 mL acetonitrile for HPLC analysis. By contrast, the previously reported methods use 14-158 mL harmful reagents (Methods 1-6). Method 7 uses less organic reagents (9.6 mL), which is attributed to the application of LC-MS. However, LC-MS is an expensive instrument with low applicability in conventional laboratories, which limits the use of rapid method to a certain extent. Relative to the previously reported methods, the currently developed method can save cost and reduce environmental pollution.
Table 4 The reported methods for simultaneously detecting AP and DAP contents in A. paniculata.
| NO. | Sample extraction | HPLC separation | Total time/min | Standard numbers | Harmful solvent | LOQ (μg/g) | Ref. | ||||
|---|---|---|---|---|---|---|---|---|---|---|---|
| Method | Solvent and sample | Time/min | Method | Mobile phase | Time/min | ||||||
| 1 | SE | 150 mL methanol; 1 g | 210 | HPLC-UV | 55% Methanol; isocratic elution | 16 | 226 | 2 | 158.8 mL methanol | N/A | [7] |
| 2 | MSE | 110 mL methanol; 1 g | 240 | HPLC-UV | 60% Methanol (pH 2.8 with PA); isocratic elution | 12 | 252 | 2 | 117.2 mL methanol | N/A | [22] |
| 3 | CME | 200 mL biocompatible microemulsion; 20 g | 5760 | HPLC-PAD | Acetonitrile-H2O; gradient elution | 46 | 5806 | 2 | 15.5 mL acetonitrile | N/A | [11] |
| 4 | UE+CS | 25 mL methanol; 0.2 g | 40 | HPLC-PAD | Acetonitrile-H2O; gradient elution | 20 | 60 | 2 | 25 mL methanol + 9.4 mL acetonitrile | 26.25 61.25 | [23] |
| 5 | DMAE | petroleum ether + 6 mL 60% methanol; not mentioned | 726 | HPLC-DAD | 65% Methanol; isocratic elution | 7 | 733 | 2 | petroleum ether + 8.1 mL methanol | 1020 1140 | [24] |
| 6 | UE+CS | 10 mL methanol; 1 g | 30 | HPLC-DAD+LC-MS | 75% Methanol (contain 0.1% ORTHOPHOS); 65% Methanol; isocratic elution | 10 | 40 | 2 | 14 mL methanol | N/A | [25] |
| 7 | UE+MSPD | 11 mL 40% methanol + 5 mL methanol; 0.1 g | 10 | LC-MS | 35% Acetonitrile (contain 0.5mM AA); isocratic elution | 1 | 11 | 2 | 9.4 mL methanol + 0.25 mL acetonitrile | 11 44 | [26] |
| Current method | MSPD | 2 mL 40% methanol + 5 mL methanol; 30 mg | 5 | HPLC-UV | Acetonitrile-H2O; gradient elution | 5 | 10 | 1 | 5.8 mL methanol + 2.7 mL acetonitrile | 80.85 80.63 | — |
AP: andrographolide; DAP: dehydroandrographolide; SE: Soxhlet extraction; MSE: magnetic stirring extraction; PA: phosphoric acid; CME: cold macerating extraction; UE: ultrasonically extraction; CS: centrifugal separation; ORTHOPHOS: orthophosphoric acid; DMAE: dynamic microwave-assisted extraction; MSPD: matrix solid-phase dispersion; AA: ammonium acetate; PAD: photodiode array detector; DAD: diode array detector; LOQ: limit of quantification.
5 Conclusion
This study explores the UV absorption feature of AP and DAP, and obtains their UV EAWs, based on which an HPLC-UV at EAW method that can rapidly detect AP and DAP contents in A. paniculata is developed. This method achieves content detection of two components only using one reference component. Compared with the Chinese Pharmacopoeia method (2020 edition) and the previously reported methods, the currently developed method is simple, rapid, and cost-effective, providing scientific evidence for improving quality evaluation of A. paniculata and its relevant products, and offering reference for exploring rapid green HPLC quantification analysis methods of other herbal medicines.
Back Matter
Acknowledgments
Not applicable.
Conflicts of Interest
The authors declared that they have no conflicts of interest to this, and that they do not have any commercial orassociative interest that represents a conflict of interest in connection with the work.
Author Contributions
Q.H and Q.L. contributed to the conception of conceptualized the study; D.L. and W.L. performed the data analysis and wrote the manuscriptexperiments; Z.Q. and D.L. contributed significantly to the analysis and reagents, materials and data analysis manuscript preparation; Q.H. and Q.L. wrote the first draft of the manuscript. All authors read the manuscript and agreed to its contents.
Ethics Approval and Consent to Participate
No ethical approval was required for this article.
Funding
This study was financially supported by the Key-Area Research and Development Program of Guangdong Province (2020B1111110005) and GDST(DGSTB)-FDCT projects (2022A0505020031).
Availability of Data and Materials
The data presented in this study are available on request from the corresponding author.
Supplementary Materials
The following supporting information can be downloaded at: https://ojs.exploverpub.com/index.php/jecacm/article/view/187/sup. Table S1: The impacts of different EAWs on AP and DAP separation efficiency (bandwidth of 2 nm). Table S2: The impacts of different bandwidths on AP and DAP separation efficiency (=240 nm). Table S3: The retention time difference and relative retention time of DAP in different HPLC columns. Table S4: The repeatability results of sample S1. Table S5: The stability results of sample S1. Table S6: The content results of current developed method (A) and the Chinese Pharmacopoeia method (B). Figure S1: The impacts of methanol at different concentrations on AP and DAP separation efficiency. Figure S2: The UV spectrum of AP and DAP (A) and HPLC chromatogram of sample (B). Figure S3: The impacts of different flow rates (F) and temperatures (T) on AP and DAP separation efficiency. Figure S4: The calibration curves of AP and DAP. Figure S5: Chromatograms of current developed method (A) and the Chinese Pharmacopoeia method (B).
References
- Chinese Pharmacopoeia Commission. Pharmacopoeia of the People’s Republic of China, 1st ed.; China Medical Science Press: Beijing, China, 2020; pp. 280-281.
- Patil R, Jain V. Andrographolide: A Review of Analytical Methods. Journal of Chromatographic Science 2021; 59(2): 191-203.
- Kumar S, Singh B, Bajpai V. Andrographis paniculata (Burm.f.) Nees: Traditional uses, phytochemistry, pharmacological properties and quality control/quality assurance. Journal of Ethnopharmacology 2021; 275: 114054.
- Fu SJ, Du LM, Yuan Y, et al. Quality Evaluation of Andrographis paniculata Capsules Based on Rapid and Accurate LC-ESI-MS/MS Assay of Three Diterpenoids. Journal of Chromatographic Science 2019; 57(8): 708-714.
- Xu FF, Fu SJ, Gu SP, et al. Simultaneous determination of andrographolide, dehydroandrographolide and neoandrographolide in dog plasma by LC-MS/MS and its application to a dog pharmacokinetic study of Andrographis paniculata tablet. Journal of Chromatography B 2015; 990: 125-131.
- Wang S, Zhao MM, Ding WJ, et al. Simultaneous quantification of six constituents in Qing-Huo-Zhi-Mai tablet by high-performance liquid chromatography-tandem mass spectrometry. Journal of Chromatographic Science 2015; 53(1): 24-30.
- Kasemsumran S, Apiwatanapiwat W, Ngowsuwan K, et al. Rapid selection of Andrographis paniculata medicinal plant materials based on major bioactive using near-infrared spectroscopy. Chemical Papers 2021; 75(11): 5633-5644.
- Phattanawasin P, Sotanaphun U, Buranaosot J. Thin-layer chromatography–image analysis method for the simultaneous quantification of andrographolide and related diterpenoids in Andrographis paniculata. Journal of Planar Chromatography 2014; 27(2): 140-144.
- Zhao JX, Yang GK, Liu HX, et al. Determination of andrographolide, deoxyandrographolide and neoandrographolide in the Chinese herb Andrographis paniculata by micellar electrokinetic capillary chromatography. Phytochemical Analysis 2002; 13(4): 222-227.
- Yang MH, Wang JS, Kong LY. Quantitative analysis of four major diterpenoids in Andrographis paniculata by 1H NMR and its application for quality control of commercial preparations. Journal of Pharmaceutical and Biomedical Analysis 2012; 70: 87-93.
- Liu XY, Niu X, Feng QJ, et al. A new biocompatible microemulsion increases extraction yield and bioavailability of Andrographis paniculata. Chinese Journal of Natural Medicines 2016; 14(9): 683-691.
- Song HY, Chang KJ, Zhang L, et al. Matrix solid-phase dispersion coupled with HPLC-UV for simultaneous extraction, purification and determination of six lignans in Schisandra chinensis fruits. Journal of Chromatographic Science 2022; 60(4): 387-400.
- Jiang LY, Wang J, Zhang H, et al. New vortex-synchronized matrix solid-phase dispersion method for simultaneous determination of four anthraquinones in Cassiae Semen. Molecules 2019; 24: 1312.
- Li WQ, Qian ZM, Lei QG, et al. An ultra-rapid and eco-friendly method for determination of loganic acid and gentiopicroside from Gentianae Macrophyllae Radix by vortex-assisted matrix solid-phase dispersion extraction and LC-MS. Journal of Pharmaceutical and Biomedical Analysis 2023; 222: 115085.
- Tanaka N, McCalley DV. Core-Shell, Ultrasmall particles, monoliths, and other support materials in high-performance liquid chromatography. Analytical Chemistry 2016; 88: 279-298.
- Qian ZM, Wu Z, Huang Q, et al. Development of an eco-friendly and fast HPLC method for quantitative analysis of four nucleosides in Cordyceps and related products. Chinese Journal of Natural Medicines 2021; 19(12): 954-960.
- Xu XY, Wang SM, Wang HM, et al. Simultaneous quantitative assays of 15 ginsenosides from 119 batches of ginseng samples representing 12 traditional Chinese medicines by ultra-high performance liquid chromatography coupled with charged aerosol detector. Journal of Chromatography A 2021; 1655: 462504.
- Li WJ, Lei QG, Li WQ, et al. Determination of 4 nucleosides via one reference compound in Chinese Cordyceps by HPLC-UV at equal absorption wavelength. Natural Product Communications 2023; 18(3): 1-7.
- Qian ZM, Huang DQ, He ZB, et al. Rapid determination of three organic acids in Polygonum Vivipari Rhizoma via one marker by HPLC-UV at equal absorption wavelength and effervescence-assisted matrix solid-phase dispersion. International Journal of Analytical Chemistry 2023; 2023: 5546053.
- Chen LM, Gao HM, Hu XH, et al. Establishment of QAMS method with dehydroandrographolide as internal reference substance for quality control of Andrographis Herba. China Journal of Chinese Materia Medica 2019; 44(4): 730-739.
- Song YX, Liu SP, Jin Z, et al. Qualitative and quantitative analysis of Andrographis paniculata by rapid resolution liquid chromatography/time-of-flight mass spectrometry. Molecules 2013; 18(10): 12192-12207.
- Akowuah GA, Zhari I, Norhayati I, et al. HPLC and HPTLC densitometric determination of andrographolides and antioxidant potential of Andrographis paniculata. Journal of Food Composition and Analysis 2006; 19(2-3): 118-126.
- Zhao Y, Kao CP, Wu KC, et al. Chemical compositions, chromatographic fingerprints and antioxidant activities of Andrographis Herba. Molecules 2014; 19(11): 18332-18350.
- Chen LG, Jin HY, Ding L, et al. On-line coupling of dynamic microwave-assisted extraction with high-performance liquid chromatography for determination of andrographolide and dehydroandrographolide in Andrographis paniculata Nees. Journal of Chromatography A 2007; 1140(1-2): 71-77.
- Yin XL, Gu HW, Wu Q, et al. Second-order calibration serves as a remedial measure for the simultaneous determination of andrographolide and dehydroandrographolide in Andrographis paniculata and its preparations by HPLC without complete baseline separation. Journal of Separation Science 2018; 41(16): 3232-3240.
- Qian ZM, Chen J, Lei QG, et al. Ultra-rapid determination of andrographolide and dehydroandrographolide in Andrographis Herba by solid phase extraction and liquid chromatography with mass spectrometry. Acta Chromatographica 2023.